Rahul
 LeetCode #155: Min Stack — Design a Stack with O(1) Minimum Retrieval
 LeetCode #20: Valid Parentheses — Master the Stack Pattern
 LeetCode #15: 3Sum — Master Sorting, Two Pointers and Duplicate Handling
 Instruction vs Context in AI Prompts: How to Tell AI What to Do and What Information to Use
 Rust Structs and Enums: Building Powerful Data Models
 Dissecting the High-Level System Architecture of Booking.com
 Kanban vs. Scrum: Which Agile Methodology to Choose?
 The Scaling Journey of LinkedIn: From Startup to Professional Powerhouse
 Mastering Code Review: A Guide for Reviewers and PR Creators
 ChatGPT: Unveiling the Power of AI in Conversational Experiences with Kairos Coders

Kairos Coders are here to help
Imagine trying to understand a complicated road journey by reading a list of 100 written instructions.
It would probably be easier if you could simply see the route on a map.
Algorithms work in a similar way.
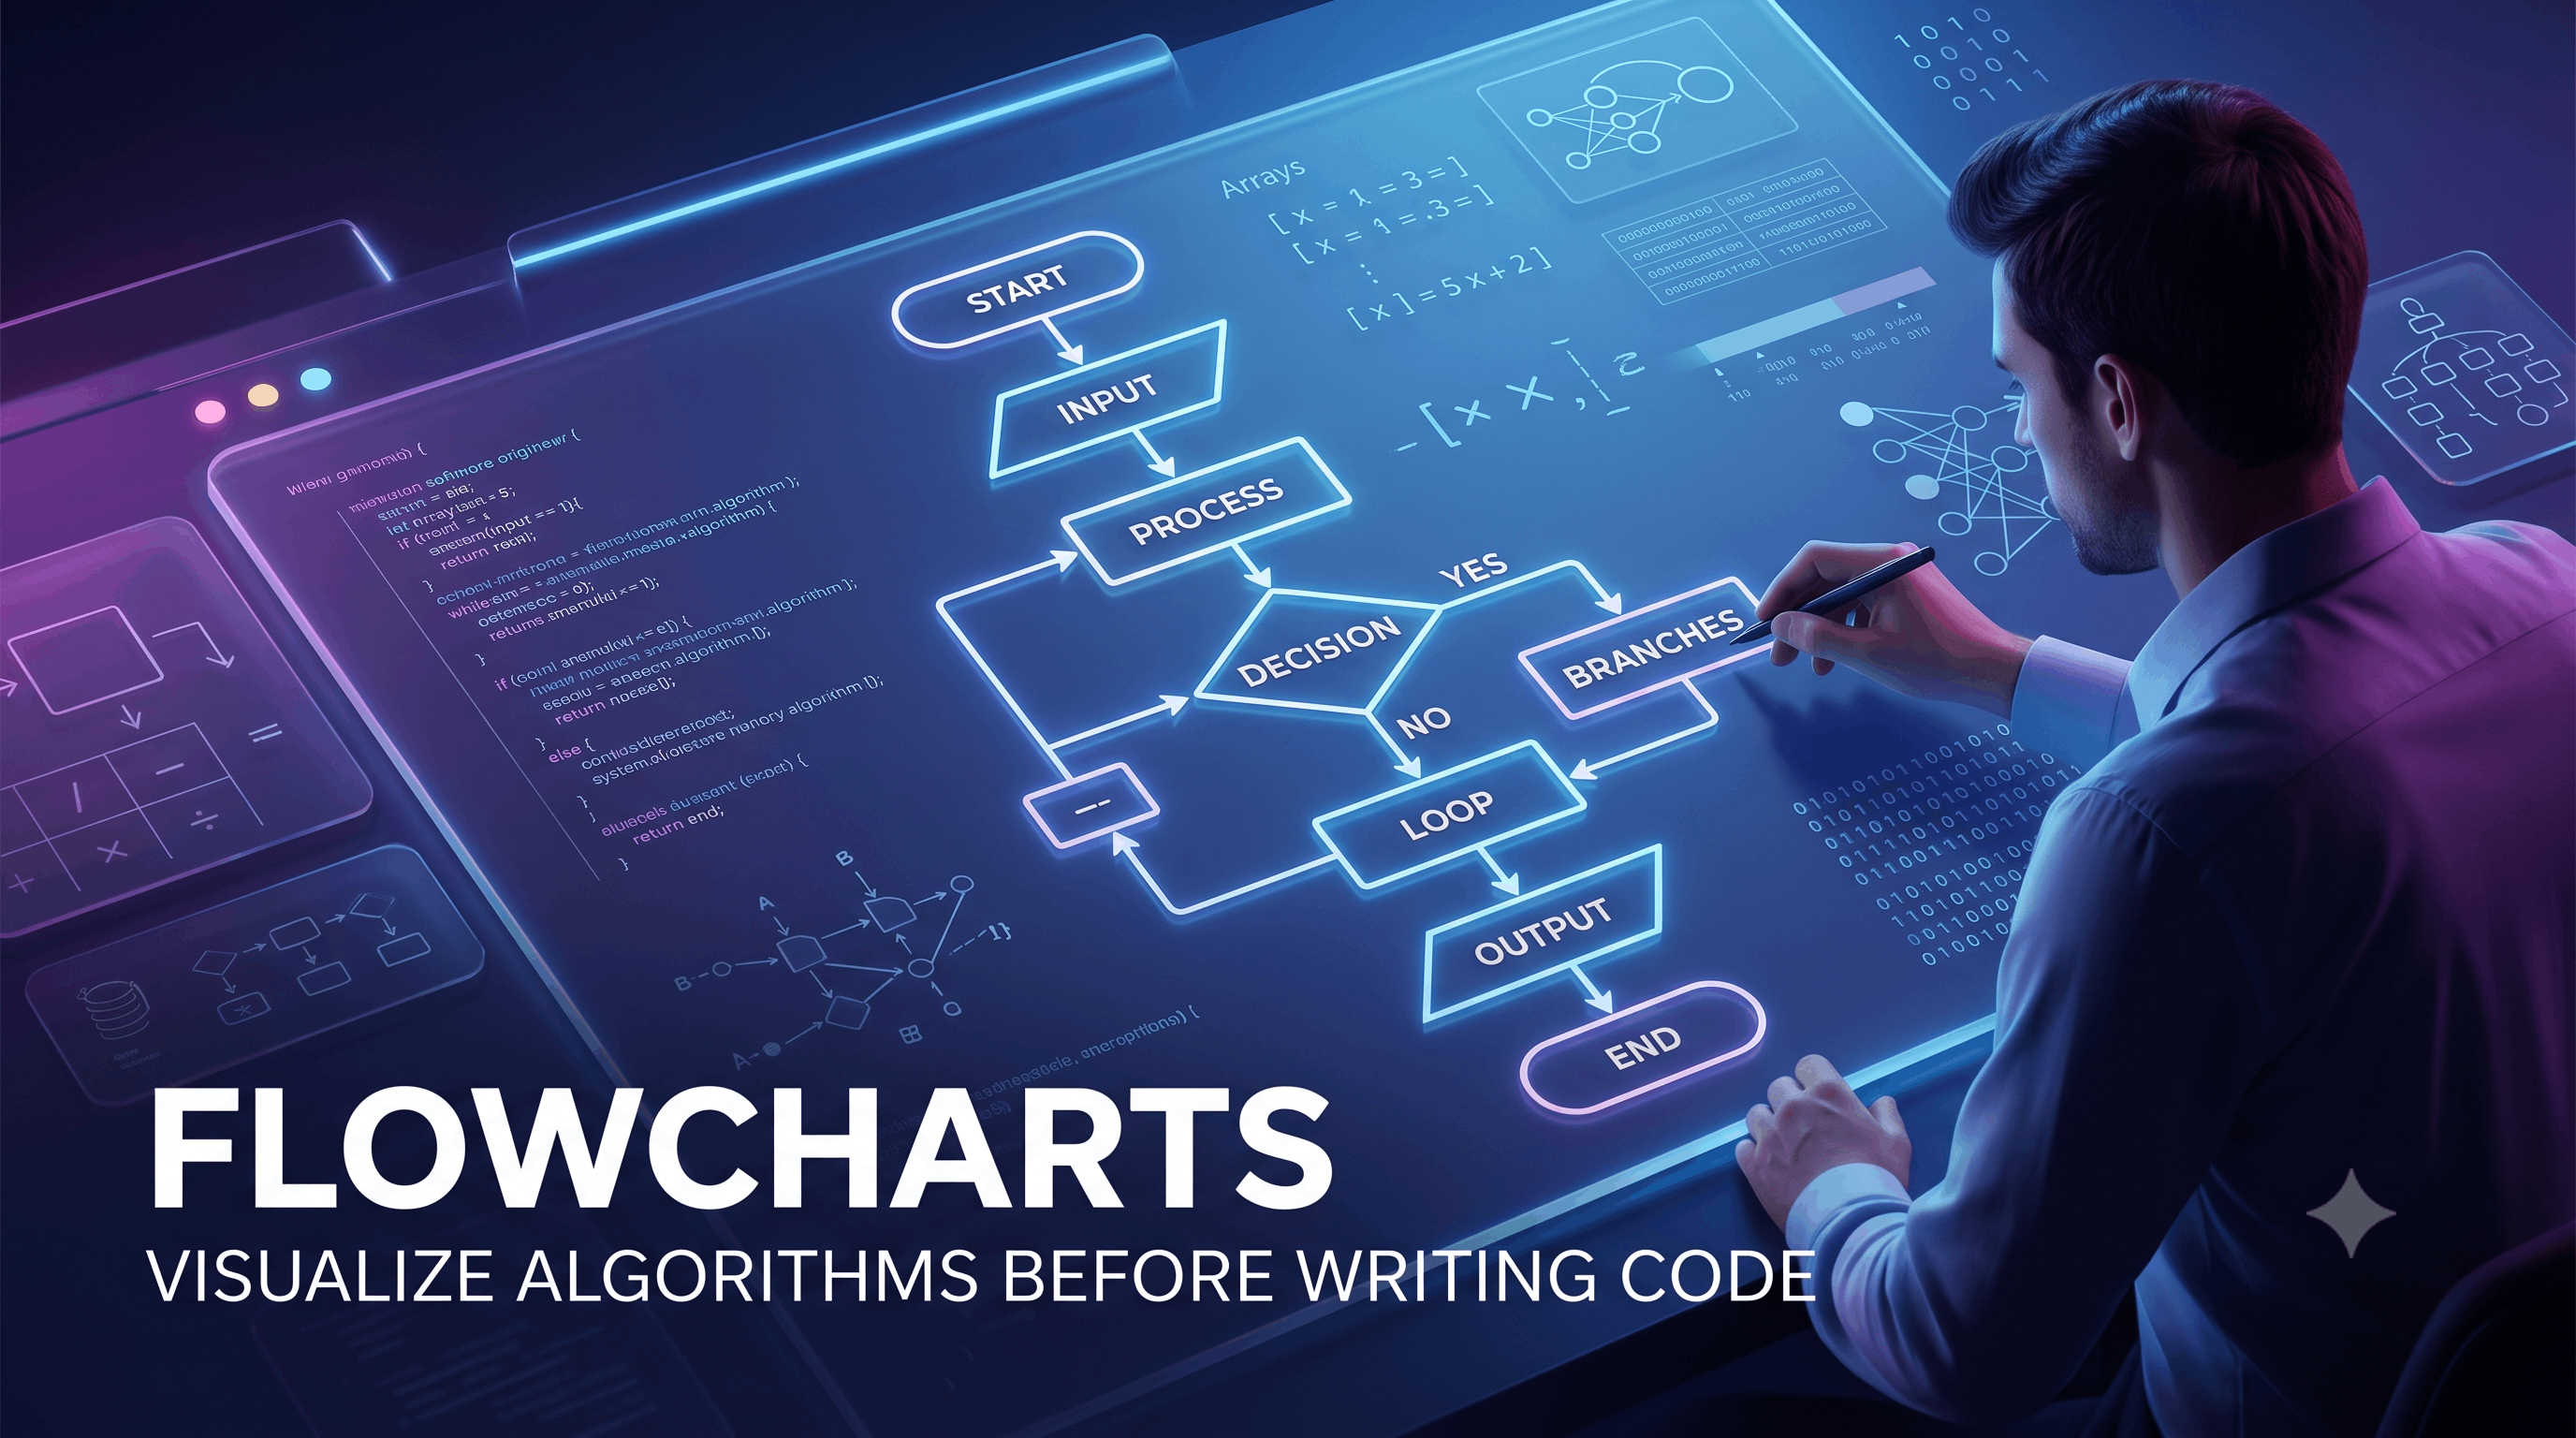
Pseudocode lets us describe an algorithm using text, but a flowchart lets us see the algorithm visually.
Instead of reading:
Read age
If age >= 18
    Print "Adult"
Otherwise
    Print "Minor"
we can visualize it as:
START
  ↓
INPUT AGE
  ↓
AGE >= 18?
 ↙       ↘
YES       NO
 ↓         ↓
ADULT     MINOR
  ↘       ↙
     END
This simple visual representation makes the logic much easier to understand.
In the previous article, we learned how to write algorithms using pseudocode.
Now we will learn how to represent those algorithms using flowcharts.
A flowchart is a visual representation of a process, algorithm, or workflow using standardized symbols connected by arrows.
In programming, flowcharts are commonly used to visualize:
The basic idea is:
Algorithm
    ↓
Visual representation
    ↓
Flowchart
Instead of reading every instruction, you can follow the arrows and understand how the process moves.
Flowcharts are especially useful when an algorithm contains:
They can help you:
See how the algorithm works.
Plan a solution before writing code.
Explain logic to another developer or non-technical person.
Identify incorrect paths or missing conditions.
Create a visual reference for future development.
Suppose we want to determine whether a number is positive or negative.
The algorithm is:
1. Start
2. Input number
3. Check whether number >= 0
4. If yes, print "Positive"
5. Otherwise, print "Negative"
6. Stop
A flowchart representation would be:
       ┌─────────┐
       │  START  │
       └────┬────┘
            ↓
     ┌──────────────┐
     │ INPUT NUMBER │
     └──────┬───────┘
            ↓
       ┌───────────┐
       │ NUMBER>=0?│
       └───┬───┬───┘
          YES   NO
           ↓     ↓
    ┌──────────┐ ┌───────────┐
    │ POSITIVE │ │  NEGATIVE │
    └─────┬────┘ └─────┬─────┘
          └──────┬─────┘
                 ↓
            ┌────────┐
            │  END   │
            └────────┘
You can immediately see the two possible paths.
Flowcharts use different symbols for different types of operations.
The most common symbols are:
| Symbol | Name | Purpose |
|---|---|---|
| Oval | Terminator | Start or End |
| Rectangle | Process | Operation or calculation |
| Diamond | Decision | Condition with multiple paths |
| Parallelogram | Input/Output | Reading or displaying data |
| Arrow | Flow Line | Shows direction |
| Circle | Connector | Connects parts of a flowchart |
Let's understand them individually.
The terminator is usually represented by an oval or rounded rectangle.
It indicates where the algorithm begins or ends.
   ┌─────────────┐
   │    START    │
   └─────────────┘
and:
   ┌─────────────┐
   │     END     │
   └─────────────┘
Every basic algorithm should have a clear starting point and ending point.
A rectangle represents an operation or processing step.
For example:
┌─────────────────┐
│ total = A + B   │
└─────────────────┘
Other examples:
┌─────────────────┐
│ Calculate total │
└─────────────────┘
┌─────────────────┐
│ Sort the array │
└─────────────────┘┌─────────────────┐
│ count = count+1 │
└─────────────────┘Whenever the algorithm performs an operation, a process symbol can represent it.
The diamond is one of the most important flowchart symbols.
It represents a condition.
For example:
        ◇
   Age >= 18?
It normally creates two or more paths.
             ┌─────────────┐
             │ Age >= 18 ? │
             └──────┬──────┘
                 YES │ NO
                  ↙    ↘
             Adult     Minor
A decision can represent:
Is number even?
Is password correct?
Is user logged in?
Is payment successful?
Is inventory available?
Is temperature above 30°C?A parallelogram usually represents input or output.
For input:
╱────────────────╲
│   INPUT AGE     │
╲────────────────╱
For output:
╱────────────────╲
│  PRINT RESULT   │
╲────────────────╱
This helps distinguish data entering the algorithm from processing performed by the algorithm.
Arrows show the direction in which the algorithm progresses.
For example:
START
  ↓
INPUT
  ↓
PROCESS
  ↓
OUTPUT
  ↓
END
Without arrows, a flowchart becomes difficult to follow.
Large flowcharts can become difficult to read when lines cross the entire diagram.
Connectors allow different sections to be connected without drawing long arrows.
They are especially useful in complex algorithms and system diagrams.
Many simple algorithms follow this pattern:
START
  ↓
INPUT
  ↓
PROCESS
  ↓
OUTPUT
  ↓
END
For example, adding two numbers:
       START
         ↓
    Input A, B
         ↓
      A + B
         ↓
   Output Result
         ↓
        END
This is the visual version of a simple algorithm.
Let's design a complete flowchart.
Add two numbers.
1. Start
2. Input A
3. Input B
4. Calculate A + B
5. Display result
6. End ┌─────────┐
│ START │
└────┬────┘
↓
╱─────────────╲
│ INPUT A,B │
╲──────┬──────╱
↓
┌────────────────┐
│ result = A + B │
└───────┬────────┘
↓
╱────────────────╲
│ OUTPUT RESULT │
╲───────┬────────╱
↓
┌─────────┐
│ END │
└─────────┘The entire algorithm can now be understood visually.
Let's make a decision-based flowchart.
INPUT number

IF number MOD 2 = 0
    OUTPUT "Even"
ELSE
OUTPUT "Odd" START
↓
INPUT NUMBER
↓
┌────────────────┐
│ NUMBER MOD 2=0?│
└───────┬────────┘
YES│NO
↙ ↘
EVEN ODD
↘ ↙
↓
ENDThe diamond represents the decision.
Problem:
A = 25
B = 40
We want:
40 START
↓
INPUT A, B
↓
┌──────────┐
│ A > B ? │
└────┬─────┘
YES│NO
↙ ↘
A B
↘ ↙
↓
OUTPUT LARGE
↓
ENDThe algorithm branches based on a comparison.
Now let's make it more interesting.
Input:
A = 25
B = 40
C = 32
We need to find:
40One approach is:
Start
 ↓
Input A, B, C
 ↓
Is A > B?
 ↓
Compare largest candidate with C
 ↓
Output largest
 ↓
End
A more detailed representation:
                 START
                   ↓
              INPUT A,B,C
                   ↓
               A > B ?
              /       \
            YES       NO
             ↓         ↓
          largest=A  largest=B
             \         /
              \       /
               ↓     ↓
              largest > C?
                /    \
              YES    NO
               ↓      ↓
          keep largest  largest=C
                \      /
                 \    /
                   ↓
             OUTPUT LARGEST
                   ↓
                  END
This illustrates why flowcharts become useful as logic becomes more complex.
Flowcharts can also represent repetition.
Suppose we want to print numbers from 1 to 5.
1. Set number = 1.
2. Check whether number <= 5.
3. Print number.
4. Increase number by 1.
5. Repeat.
6. Stop when number > 5. START
↓
number = 1
↓
┌──────────────┐
│ number <= 5? │
└──────┬───────┘
YES│NO
↓ ↘
OUTPUT NUMBER END
↓
number = number + 1
│
└───────────┐
│
↓
number <= 5?Notice the arrow going back.
That represents a loop.
A loop generally looks like:
        ┌─────────────┐
        │  CONDITION  │
        └──────┬──────┘
             YES│
                ↓
             PROCESS
                ↓
          UPDATE VALUE
                │
                └─────────────┐
                              │
                              ↓
                          CONDITION
If the condition is false:
CONDITION
   ↓
 NO
   ↓
END
This is the visual structure behind many loops in programming.
Flowcharts aren't limited to mathematical problems.
Imagine a login process.
              START
                ↓
          INPUT USERNAME
                ↓
          INPUT PASSWORD
                ↓
        ┌─────────────────┐
        │ CREDENTIALS     │
        │     VALID?      │
        └───────┬─────────┘
             YES│NO
              ↙   ↘
        DASHBOARD  ERROR
              ↘   ↙
                ↓
               END
This is already similar to real-world application logic.
A simplified checkout algorithm might be:
START
  ↓
Cart
  ↓
Is cart empty?
 ↙        ↘
YES        NO
 ↓          ↓
Show       Checkout
message      ↓
           Payment
              ↓
        Payment successful?
           ↙       ↘
         YES        NO
          ↓          ↓
       Create       Show
       order        error
          ↓
       Send confirmation
          ↓
         END
This is a simplified version of logic that appears in real e-commerce applications.
Both are useful, but they have different strengths.
| Feature | Pseudocode | Flowchart |
| Representation | Text | Visual |
| Easy to write | Yes | Moderate |
| Easy for complex logic | Usually | Can become crowded |
| Shows branching | Yes | Very clearly |
| Shows loops | Yes | Very clearly |
| Good for documentation | Yes | Yes |
| Language independent | Yes | Yes |
| Best for visual learners | Moderate | Excellent |
A good programmer should be comfortable with both.
Flowcharts are particularly useful when:
They help beginners understand control flow.
You can visualize the solution before implementation.
Non-programmers can often understand diagrams more easily than code.
A visual representation can reveal incorrect branches.
Flowcharts can explain business workflows and technical systems.
Flowcharts aren't always the best tool.
For very large algorithms, the diagram can become enormous.
Imagine trying to create a flowchart for:
The diagram could become difficult to maintain.
In such cases, developers may use:
The right visualization depends on the problem.
Try to keep the flow moving in a consistent direction.
For example:
TOP
 ↓
BOTTOM
rather than creating arrows everywhere.
If a decision has branches, clearly label them:
YES
NO
or:
TRUE
FALSE
Without labels, the reader may not know which path represents which outcome.
Every major flowchart should make its beginning and ending obvious.
Don't create:
INPUT USERand then immediately expand:
Open keyboard
Read each individual character
Move cursor
Store character
...
unless those details are actually important.
Keep the abstraction level consistent.
If a flowchart becomes massive, divide it into smaller sections.
For example:
Login Flow
Payment Flow
Order Flow
Delivery Flow
This is much easier to understand.
A useful skill is being able to move between visual and textual representations.
Suppose the flowchart says:
START
 ↓
INPUT marks
 ↓
marks >= 40?
 ↙       ↘
YES       NO
 ↓         ↓
PASS      FAIL
 ↘         ↙
    END
The equivalent pseudocode is:
START

INPUT marks

IF marks >= 40
    OUTPUT "PASS"
ELSE
    OUTPUT "FAIL"
END IF

ENDThe reverse is also possible.
Pseudocode:
INPUT age

IF age >= 18
    OUTPUT "Adult"
ELSE
    OUTPUT "Minor"
END IF
Flowchart:
          INPUT AGE
              ↓
         AGE >= 18?
          ↙       ↘
        YES       NO
         ↓         ↓
      ADULT      MINOR
          ↘     ↙
             END
This flexibility is valuable when solving algorithm problems.
Eventually, the visual logic becomes actual code.
Flowchart:
INPUT NUMBER
     ↓
NUMBER % 2 == 0?
   ↙       ↘
 YES        NO
  ↓          ↓
EVEN        ODD
Python:
number = int(input("Enter a number: "))

if number % 2 == 0:
    print("Even")
else:
    print("Odd")
JavaScript:
const number = 10;

if (number % 2 === 0) {
    console.log("Even");
} else {
    console.log("Odd");
}
The same logic travels through multiple representations:
Problem
   ↓
Algorithm
   ↓
Flowchart
   ↓
Pseudocode
   ↓
CodeWhen solving an unfamiliar programming problem, you can use:
             PROBLEM
                ↓
       Understand the Goal
                ↓
        Identify Input/Output
                ↓
          Create Examples
                ↓
            Algorithm
                ↓
         ┌──────────────┐
         │ Flowchart OR │
         │  Pseudocode  │
         └──────┬───────┘
                ↓
          Dry Run Logic
                ↓
             Write Code
                ↓
              Test
                ↓
            Optimize
This process helps prevent one of the biggest beginner mistakes:
Writing code before understanding the problem.
Flowcharts aren't only educational tools.
They can be useful for planning real processes.
For example, a payment system could be represented as:
Customer
   ↓
Checkout
   ↓
Payment Gateway
   ↓
Payment Successful?
  ↙          ↘
YES          NO
 ↓            ↓
Create       Retry /
Order        Cancel
 ↓
Update Inventory
 ↓
Send Confirmation
 ↓
END
Before developers write hundreds of lines of backend code, discussing the flow can reveal:
That's why visual thinking remains valuable even for experienced engineers.
One of the biggest advantages of visualizing an algorithm is that you can ask:
What happens on every possible path?
Consider a payment system.
The normal path is:
Payment
  ↓
Success
  ↓
Order Created
But what about:
Payment Failed
Payment Timeout
Insufficient Funds
Network Failure
Duplicate Request
Inventory Unavailable
A good flowchart can make these paths visible.
This leads naturally to more robust software.
Flowcharts teach an important concept:
Every algorithm is a collection of possible paths through a process.
For example:
             CONDITION
             /       \
           YES        NO
           ↓           ↓
        PROCESS      PROCESS
           ↓           ↓
           └─────┬─────┘
                 ↓
              OUTPUT
Once you begin thinking in terms of:
you are developing fundamental algorithmic thinking skills.
Try creating a flowchart for this problem:
Given a number, determine whether it is positive, negative, or zero.
Think about the decision structure:
NUMBER > 0?
  ↓
YES → Positive

NO
 ↓
NUMBER < 0?
 ↓
YES → Negative
NO → Zero
The corresponding pseudocode would be:
START

INPUT number

IF number > 0
    OUTPUT "Positive"
ELSE IF number < 0
    OUTPUT "Negative"
ELSE
    OUTPUT "Zero"
END IF

END
Try drawing the flowchart yourself before looking at the solution.
Create a flowchart for:
Calculate whether a student receives a scholarship.
Rules:
Marks >= 90
AND
Attendance >= 75%
If both conditions are satisfied:
Scholarship ApprovedOtherwise:
Scholarship RejectedThis problem introduces an important concept:
Combining multiple conditions.
We'll explore logical operators more deeply as the series progresses.
You may be asked:
"How would you explain your algorithm to someone who doesn't know how to code?"
A flowchart can be an excellent answer.
Instead of showing:
if (...)you can show:
             Condition?
             /        \
           YES        NO
            ↓          ↓
         Action      Action
This communicates the logic without requiring the listener to understand programming syntax.
Flowcharts provide a visual way to understand algorithms.
Remember:
The key mental model is:
Problem
   ↓
Algorithm
   ↓
Flowchart
   ↓
Pseudocode
   ↓
Code
   ↓
Working SolutionPixels to Perfection Design that Impresses