Rahul
 LeetCode #155: Min Stack — Design a Stack with O(1) Minimum Retrieval
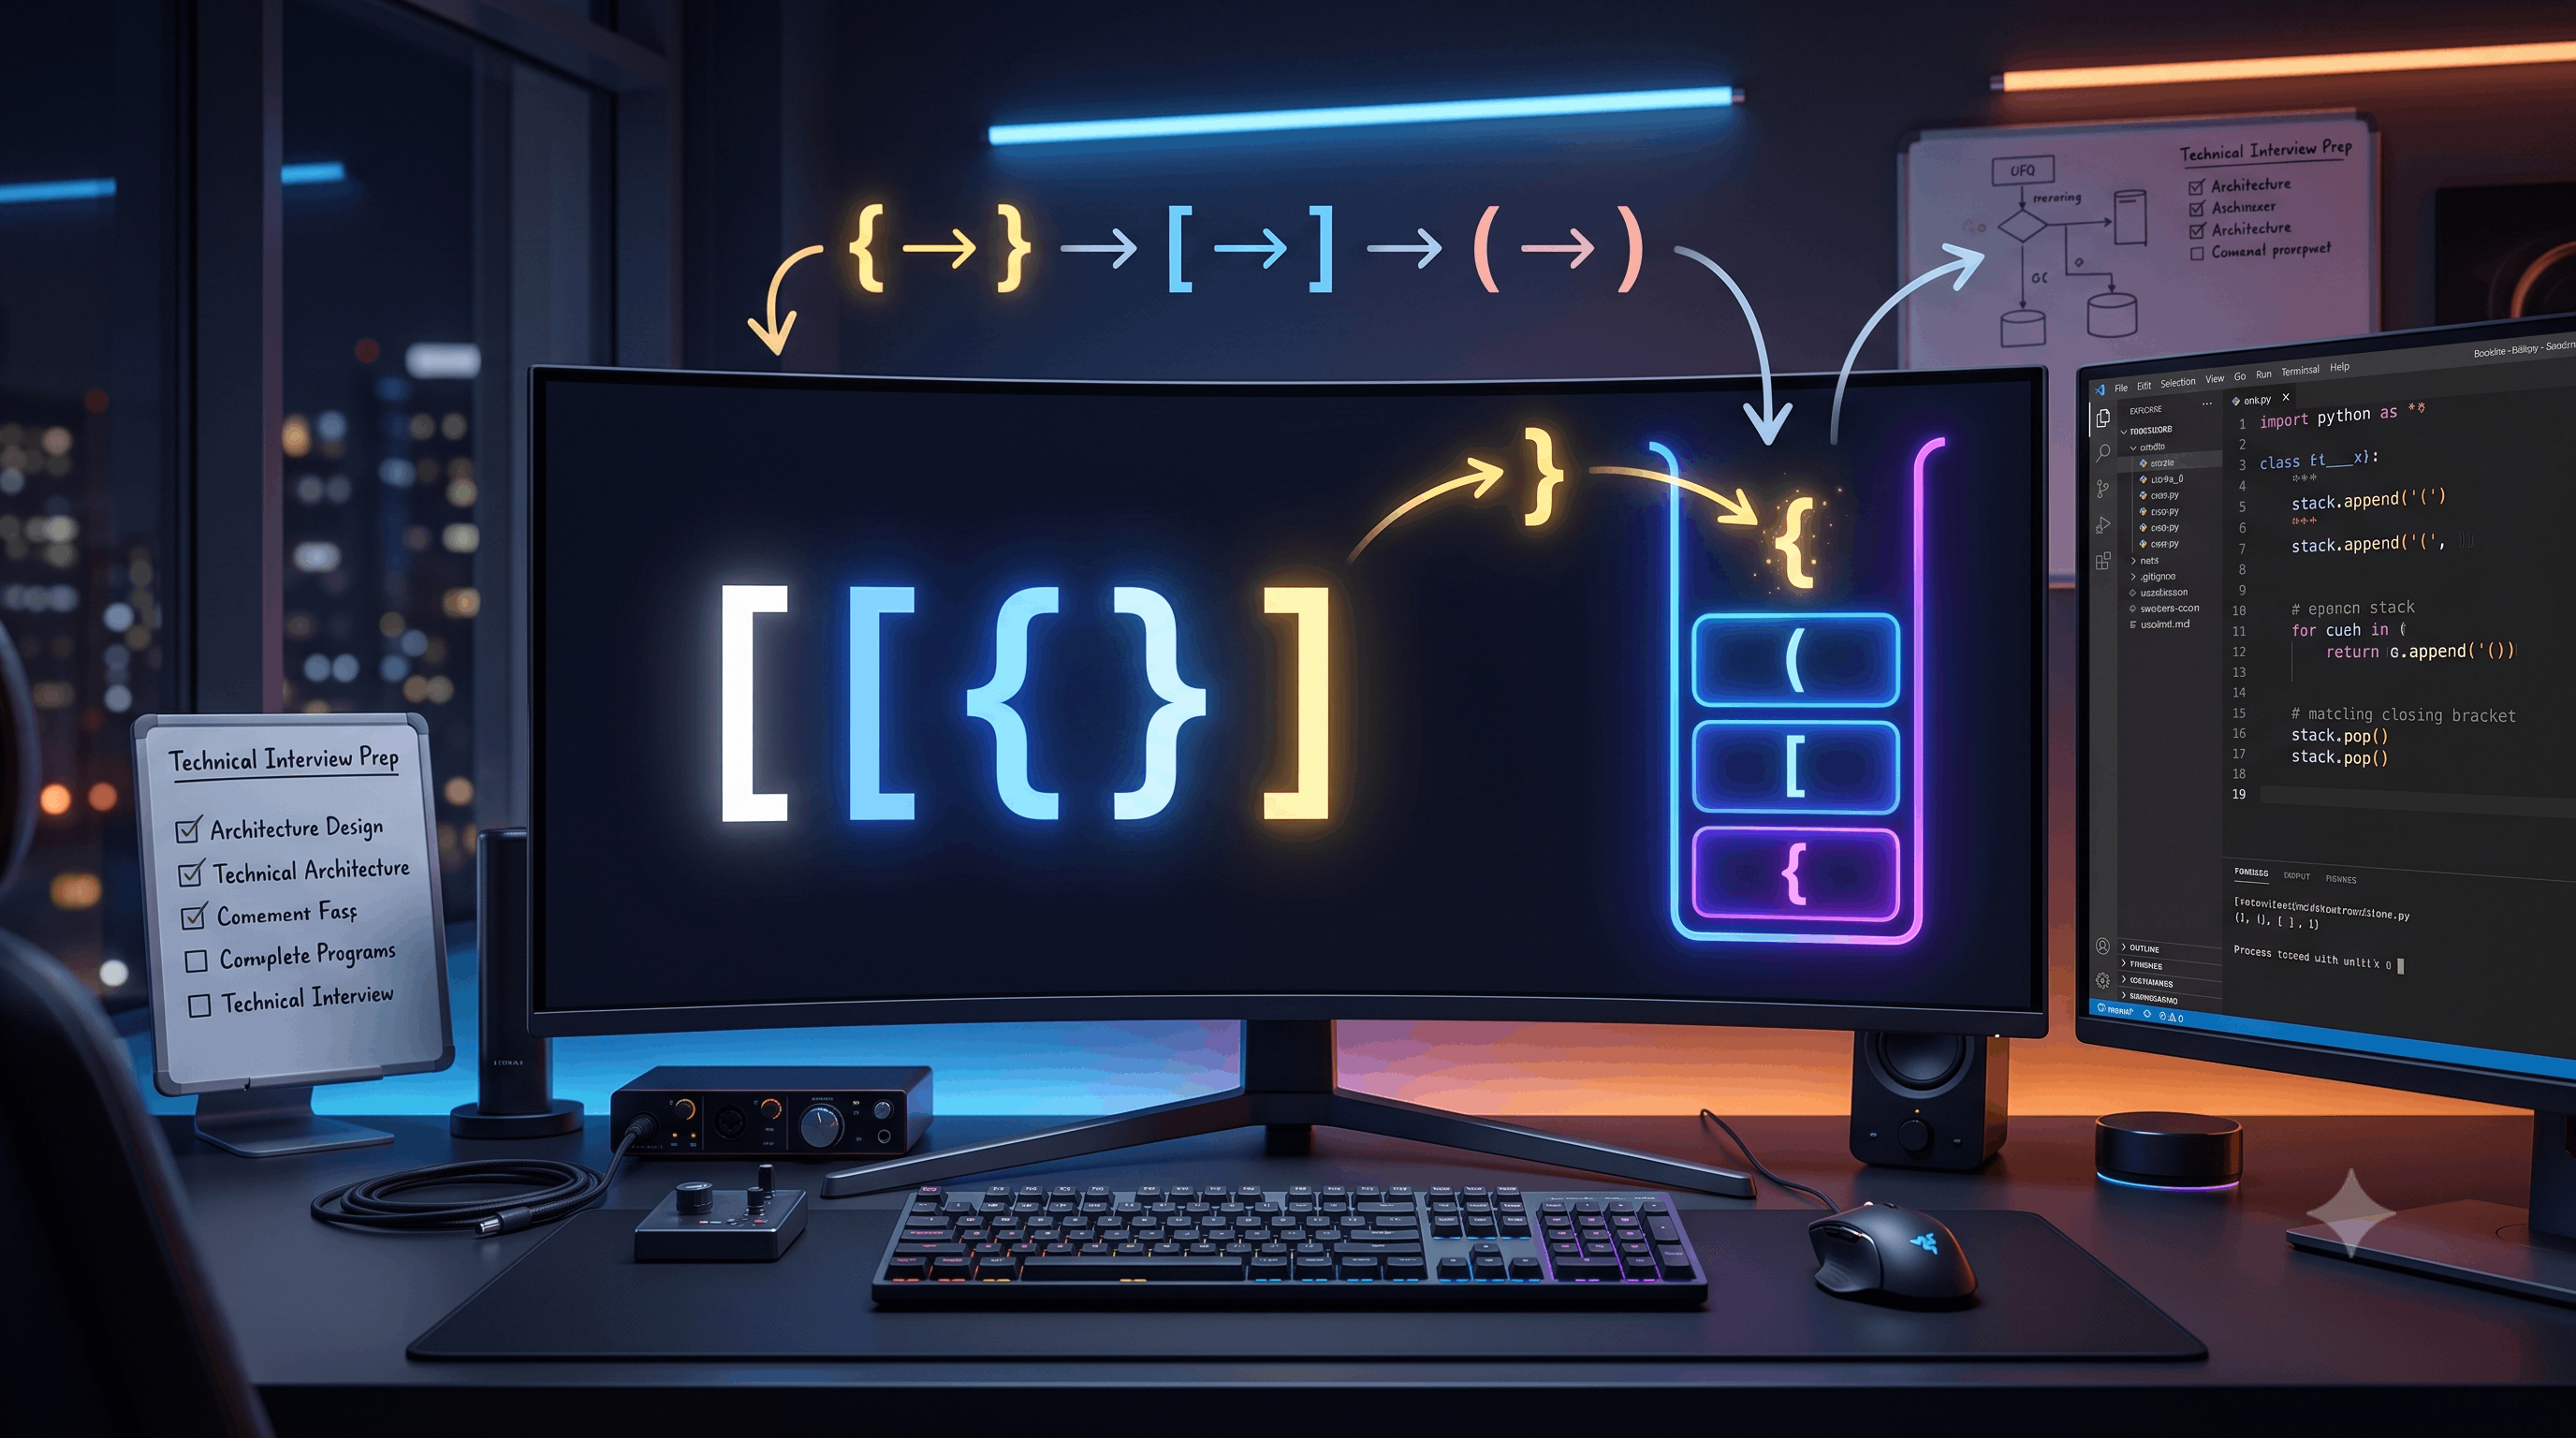 LeetCode #20: Valid Parentheses — Master the Stack Pattern
 LeetCode #15: 3Sum — Master Sorting, Two Pointers and Duplicate Handling
 Instruction vs Context in AI Prompts: How to Tell AI What to Do and What Information to Use
 Rust Structs and Enums: Building Powerful Data Models
 Dissecting the High-Level System Architecture of Booking.com
 Kanban vs. Scrum: Which Agile Methodology to Choose?
 The Scaling Journey of LinkedIn: From Startup to Professional Powerhouse
 Mastering Code Review: A Guide for Reviewers and PR Creators
 ChatGPT: Unveiling the Power of AI in Conversational Experiences with Kairos Coders

Kairos Coders are here to help
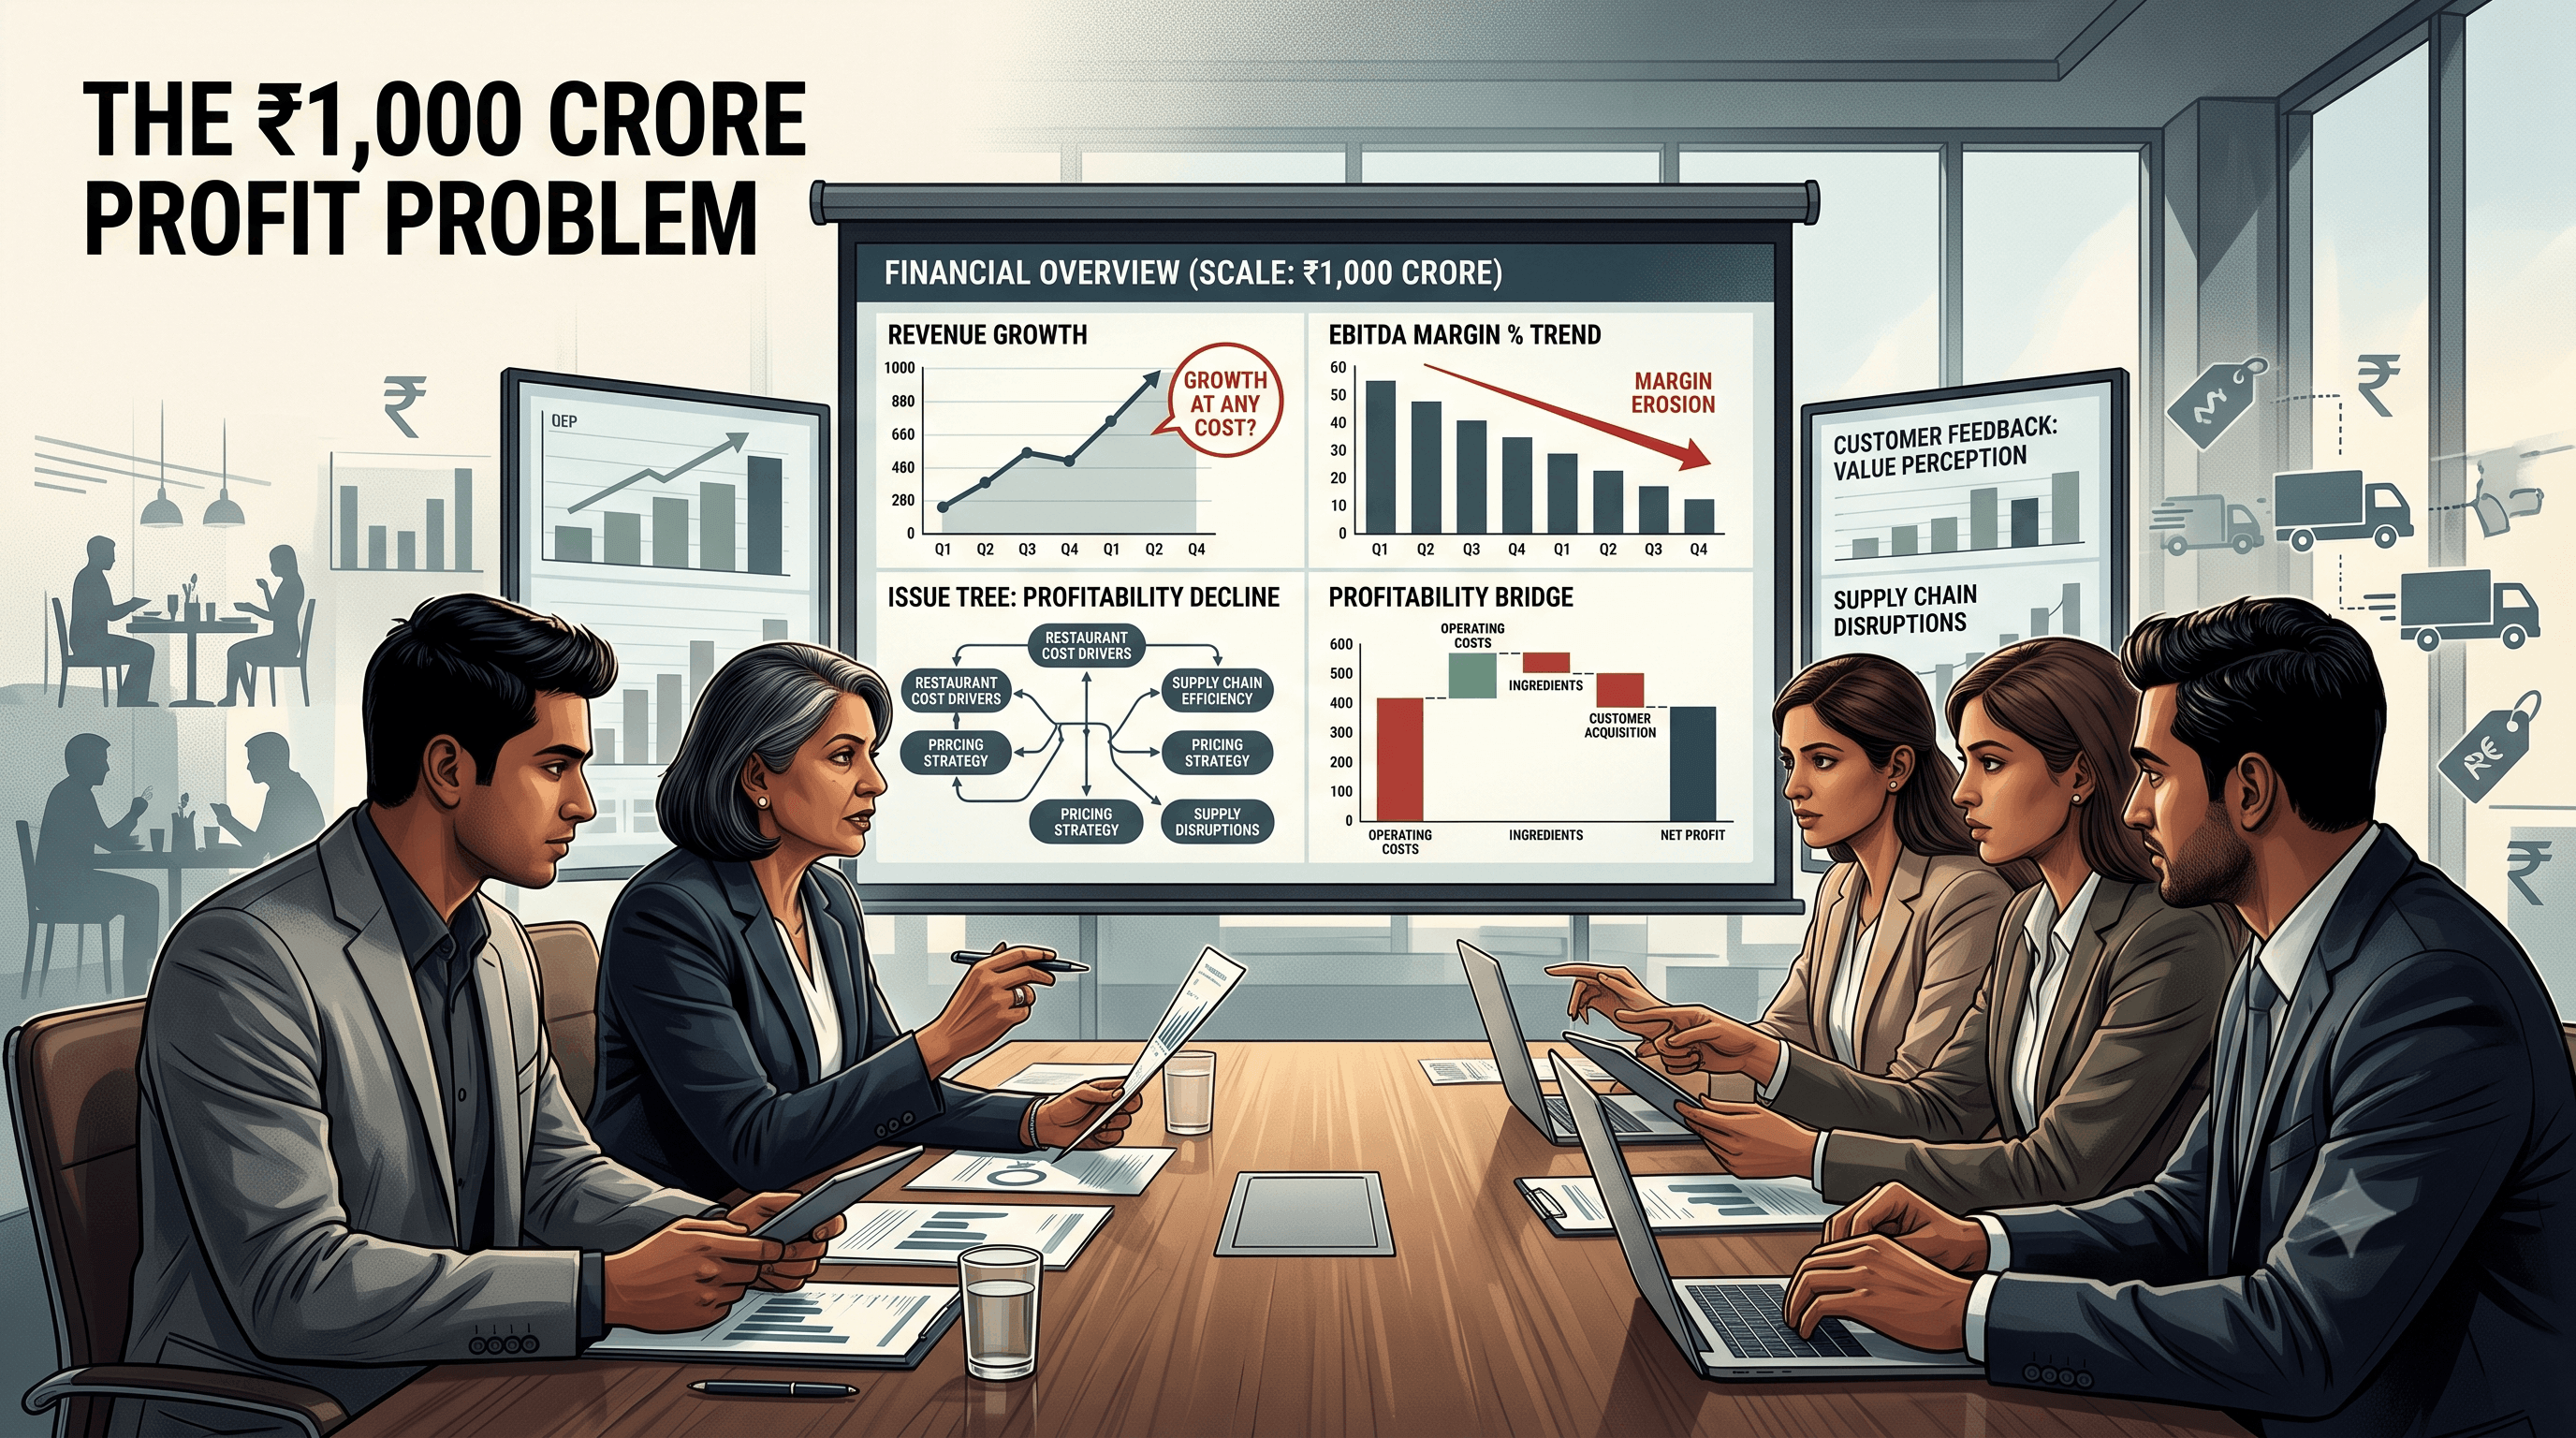
Imagine walking into a boardroom.
Across the table sits the CEO of NovaBite, a fictional Indian quick-service restaurant (QSR) company with 850 restaurants across India.
The company has been growing aggressively.
More stores.
More customers.
More orders.
More revenue.
Everything appears to be going perfectly.
But then the CFO presents the following numbers:
| Financial Metric | Year 1 | Year 2 | Year 3 |
|---|---|---|---|
| Revenue | ₹4,200 Cr | ₹5,400 Cr | ₹6,800 Cr |
| EBITDA | ₹630 Cr | ₹648 Cr | ₹544 Cr |
| EBITDA Margin | 15.0% | 12.0% | 8.0% |
Revenue increased from ₹4,200 crore to ₹6,800 crore in three years.
That's a 61.9% increase.
But EBITDA went from ₹648 crore to ₹544 crore between Year 2 and Year 3.
That's a decline of approximately 16%.
Even more concerning, EBITDA margin dropped from:
12% → 8%
The CEO looks at you and says:
"Our revenue is growing. Our customer base is growing. So why are our profits falling?"
Then comes the real assignment:
"I want you to identify the problem and find at least ₹250 crore of annual EBITDA improvement within 18 months."
You are now the consultant.
A common mistake is to immediately say:
That's not consulting.
Before recommending anything, we need to understand why profitability declined.
At the highest level:
Therefore, our first issue tree becomes:
                    EBITDA Decline
                         │
              ┌──────────┴──────────┐
              │                     │
           Revenue                Costs
              │                     │
        ┌─────┼─────┐        ┌──────┼──────┐
        │     │     │        │      │      │
      Price Volume Mix      Food   Labor   Other
Our first question is simple:
Is the problem revenue, costs, or both?
NovaBite operates restaurants across major Indian cities.
Its revenue comes from:
The company added a significant number of stores.
| Metric | Year 2 | Year 3 |
|---|---|---|
| Stores | 650 | 850 |
| Revenue | ₹5,400 Cr | ₹6,800 Cr |
| Revenue/store | ₹8.31 Cr | ₹8.00 Cr |
| Average Order Value | ₹540 | ₹435 |
| Orders | 100 million | ~156.3 million |
Immediately, we notice something interesting.
But revenue increased by only about 26%.
Revenue per store therefore declined:
₹8.31 Cr → ₹8.00 Cr
The company is expanding, but the average economics of each store are getting weaker.
That's our first warning sign.
Let's break revenue into its fundamental components.
In Year 2:
100 million orders × ₹540
= ₹54 billion
= ₹5,400 crore
Correct.
Now Year 3:
Revenue = ₹6,800 crore
Average order value = ₹435
Therefore:
₹6,800 crore ÷ ₹435 ≈ 156.3 million orders
So orders increased from:
100 million → ~156.3 million
That's approximately a:
But AOV declined from:
₹540 → ₹435
That's approximately:
This is a major clue.
The company is receiving significantly more orders.
That sounds positive.
But customers are spending less per order.
Why?
We investigate the product mix.
Suppose NovaBite's sales mix changed:
| Product Category | Year 2 | Year 3 |
|---|---|---|
| Premium products | 45% | 32% |
| Standard products | 40% | 43% |
| Low-price products | 15% | 25% |
The company increasingly pushed:
This increased order volume.
But it reduced the average amount customers spent.
This gives us an important consulting lesson:
Revenue growth doesn't automatically mean profitable growth.
The marketing team reveals another important fact.
NovaBite spent heavily on promotions to increase customer acquisition.
For example:
"₹100 OFF on orders above ₹399."
This may increase transactions.
But we need to ask:
What happens to contribution margin after the discount?
Suppose:
Customer order:
₹500
Discount:
₹100
Actual revenue:
₹400
Now subtract:
The company may discover that some promotional orders generate extremely low contribution—or even negative contribution.
The consultant therefore asks:
That's a much better question than:
Revenue isn't the only problem.
Let's examine the company's major operating costs.
| Cost Category | Year 2 | Year 3 |
|---|---|---|
| Food Cost | 30% | 34% |
| Employee Cost | 15% | 18% |
| Rent | 8% | 10% |
| Delivery Commissions | 5% | 7% |
| Marketing | 4% | 5% |
Several categories deteriorated simultaneously.
But we need to quantify the impact.
That's a core consulting principle:
Don't just identify problems. Put a number on them.
Year 3 revenue:
Current food cost:
Therefore:
₹6,800 Cr × 34% = ₹2,312 Cr
Now imagine NovaBite could bring food costs back to 30% of revenue.
Target food cost:
₹6,800 Cr × 30% = ₹2,040 Cr
Potential savings:
₹2,312 Cr − ₹2,040 Cr
That's a huge opportunity.
But we can't simply assume the company can save ₹272 crore.
We need to determine:
Why did food costs increase?
The procurement team provides three clues.
NovaBite works with 47 regional suppliers.
Purchasing volumes are fragmented.
That reduces negotiating power.
Prices of key ingredients increased.
For example:
Some of this increase may be unavoidable.
Restaurant-level wastage increased from:
That's a significant operational problem.
Food is being purchased but never converted into revenue.
The consultant recommends consolidating suppliers.
Instead of:
NovaBite could potentially move toward:
The company can negotiate based on larger purchasing volumes.
Potential initiatives:
Suppose realistic procurement savings reach:
That's our first major EBITDA opportunity.
The second problem is operational waste.
Instead of allowing restaurants to estimate inventory manually, NovaBite can introduce demand forecasting.
Forecasting can consider:
For example:
If a restaurant historically sells:
300 burgers on Saturday
but only:
180 burgers on Monday
its inventory planning shouldn't be identical.
Better forecasting can reduce:
Suppose NovaBite achieves:
from waste reduction.
Employee costs increased from:
Again, the answer isn't necessarily layoffs.
The consultant examines:
Suppose the data shows some stores have too many employees during low-demand periods.
But those same stores are understaffed during peak hours.
Better workforce scheduling can improve productivity without reducing service quality.
Potential annual improvement:
Online delivery has grown rapidly.
That's good for revenue.
But delivery can also introduce:
Consider two orders.
Revenue: ₹500
Contribution after variable costs: ₹140
Revenue: ₹500
Contribution after variable costs: ₹20
Both appear identical from a revenue perspective.
But economically, they're completely different.
NovaBite should therefore measure:
rather than simply:
Potential initiatives:
Potential EBITDA improvement:
NovaBite added 200 stores.
But not every store performs equally.
The consultant categorizes stores.
High revenue + strong profitability.
Action: Expand.
Good demand but weak profitability.
Action: Improve economics.
Low sales + negative contribution.
Action: Consider closure or relocation.
This is much better than saying:
"Close 100 stores."
Instead, define objective thresholds.
For example:
Close stores that remain below a minimum contribution level after a defined turnaround period.
Potential improvement:
Now we come to pricing.
Increasing prices across the board could be dangerous.
Customers might leave.
Instead, NovaBite can use:
For example:
| Product | Old Price | Potential New Price |
|---|---|---|
| Basic Burger | ₹149 | ₹159 |
| Premium Burger | ₹249 | ₹269 |
| Combo | ₹299 | ₹319 |
| Beverage | ₹99 | ₹109 |
But the strategy isn't simply:
"Raise prices."
It is:
Improve contribution per transaction while protecting customer demand.
NovaBite could also redesign its menu around higher-margin combinations.
Potential EBITDA improvement:
Now we put everything together.
| Initiative | Potential EBITDA Improvement |
|---|---|
| Procurement optimization | ₹90 Cr |
| Food waste reduction | ₹55 Cr |
| Labor productivity | ₹45 Cr |
| Delivery economics | ₹35 Cr |
| Store portfolio optimization | ₹25 Cr |
| Pricing & product mix | ₹60 Cr |
| Total Potential | ₹310 Cr |
The CEO requested:
Our identified opportunity:
Potential buffer:
But there's an important caveat.
These are opportunity estimates, not guaranteed profits.
A consultant must distinguish between:
and
A recommendation without implementation is incomplete.
So we create an 18-month plan.
Focus on:
The goal:
Find exactly where money is being lost.
Implement:
The goal:
Capture easy savings quickly.
Implement:
Scale successful pilots across the network.
Track:
Management should monitor a small number of critical KPIs.
This turns the strategy into a measurable operating system.
You return to the CEO.
Your recommendation is:
NovaBite should not slow growth simply because profitability has deteriorated. Instead, it should change the quality of its growth.
The company should prioritize six initiatives:
The combined opportunity is approximately:
against the CEO's target of:
But execution must be phased and measured.
At the beginning, the problem looked like:
"Our profits are falling."
After investigation, we discovered something more interesting.
NovaBite wasn't suffering from a single problem.
It had a growth-quality problem.
The company was:
Revenue growth was hiding deteriorating economics.
The CEO initially asked:
"How do we increase profit?"
A good consultant reframes the question:
"Which specific economic drivers are causing the decline, and which interventions can change them?"
That's the difference between:
and
When faced with a profitability problem, start here:
                  PROFITABILITY
                       │
             ┌─────────┴─────────┐
             │                   │
          REVENUE              COST
             │                   │
       ┌─────┼─────┐       ┌─────┼──────┐
       │     │     │       │     │      │
     Price Volume Mix     Variable Fixed Other
Then go deeper.
For example:
Revenue
  │
  ├── Customers
  │
  ├── Orders
  │
  ├── Average Order Value
  │
  └── Product Mix
And:
Costs
  │
  ├── Food
  ├── Labor
  ├── Rent
  ├── Delivery
  ├── Marketing
  └── Other Operating Costs
This gives you a structured path from:
Problem → Hypothesis → Data → Root Cause → Solution → Financial Impact
Now imagine you're sitting in a consulting interview.
The interviewer says:
"Our client operates 500 coffee shops. Revenue increased by 30%, but EBITDA declined by 20%. What would you investigate?"
Don't immediately give the interviewer a solution.
Start with:
"I'd like to understand whether the EBITDA decline is driven primarily by revenue deterioration, cost inflation, or a combination of both."
Then build your issue tree.
Then ask:
"Which of these has changed materially, and what is the financial impact of each change?"
That's the beginning of a strong case interview answer.
This single case introduced several important consulting concepts:
Breaking a complex problem into smaller components.
Structuring your analysis so major areas don't overlap unnecessarily or get missed.
Developing possible explanations and testing them with data.
Finding the underlying reason rather than treating symptoms.
Quantifying how different initiatives can improve profitability.
Understanding whether individual transactions, customers, products or stores actually make money.
Not every theoretically possible initiative should be implemented.
Turning recommendations into measurable actions.
The most important lesson from this case isn't the ₹310 crore opportunity.
It's the process used to find it.
A company can have:
Growing revenue + growing customers + growing orders
and still become less profitable.
That's why consultants don't stop at:
"Revenue is growing."
They ask:
"What is the quality of that growth?"
And that question can uncover millions—or billions—of rupees hiding inside a business.
Pixels to Perfection Design that Impresses